TUI Challenge: Day 7
Day 7: System Monitoring
Today’s task was around system monitoring which is something I have used before as I do not have any GUI system monitoring apps installed.
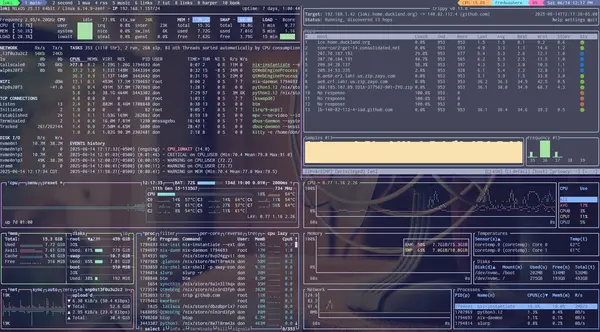
 clockwise, top left: glances,
trippy, bottom,
btop
Most of the time, when you laptop/server is running great, you do not worry about what is running or how much CPU/RAM is being consumed. But, then you notice that program start-up seemed awfully slow or that remote site was a bit slow or did not respond at all. What now? Monitoring tools to the rescue!
glances
I just found this tool recently. It gives a great overview of not just what process are running, but how your network interfaces are doing, disk i/o as well as filesystem usage, and an overview of the IRQ in use. Truly, your system at a glance. The only metric it is missing for me is temperature of the CPU and drives.
trippy
Trippy is another new find for me. It is traceroute, but all TUI up. It is easy to read, has a stop-light icon on the far right to let you know the status of each hop. Nice.
bottom
Bottom is another system resource monitor, but instead of just columns of numbers, you get a real-time chart of CPU, RAM, and network usage, along with an overview of system tempatures, disk usage (but not disk I/O), and a process overview. This is a great tool to leave up running while you are trying to track down some issue as you can see the historical trends.
btop
btop is my go-to top replacement. I even have a bash alias for top calling btop: alias top=btop and a key sequence
for my tmux config to call it up: bind '~' split-window "exec btop". btop shows the same types of information as
bottom, but goes into more details. Disk display, for example, has not just space used but disk I/O as well. It
offers a lot of configuration options. For example, in the above picture, it is using the catppuccin_mocha theme to
match the rest of my desktop, both GUI and TUI apps. Nice.
Challenge
The challenge today was to use the tools at least twice and note an observation. In the above picture, I was just starting a NixOS update and rebuild, so you can see the CPU, RAM, and network starting to get used more.
Daily totals
Yesterday left me with 155 points. Today’s basic challenge was worth 10 points, with a bonus of 5 points for customizing the display of the tool (btop’s theme). I did not do the other bonus of scripting alerts as I already have another system for that. So, 15 points today, brings the total to 170.
Challenge Bonus points
There is a bonus 30 points up for grabs if I use a terminal multiplexer. As seen in the picture above, that is tmux with the first pane split into four to show the tools off, but I also have panes for my email, RSS reader, mastodon client, and ssh shells on a couple other machines.
And for added geek points:
[don@loki:~] $ tmux list-sessions
chat: 2 windows (created Sat Jun 14 22:34:14 2025)
duckland: 3 windows (created Sat Jun 14 22:44:28 2025) (attached)
loki: 5 windows (created Sat Jun 14 22:29:16 2025)
nixos: 2 windows (created Sat Jun 14 22:29:49 2025)
Which brings my grand total to 200!